Debugging Vulkan Shaders (post processing)
I have this artifact, in my new project, with the SSR implementation that I provided a while back: The shaders are written in GLSL, and are fed to the Vulkan graphics pipeline for rendering the screen space reflections.
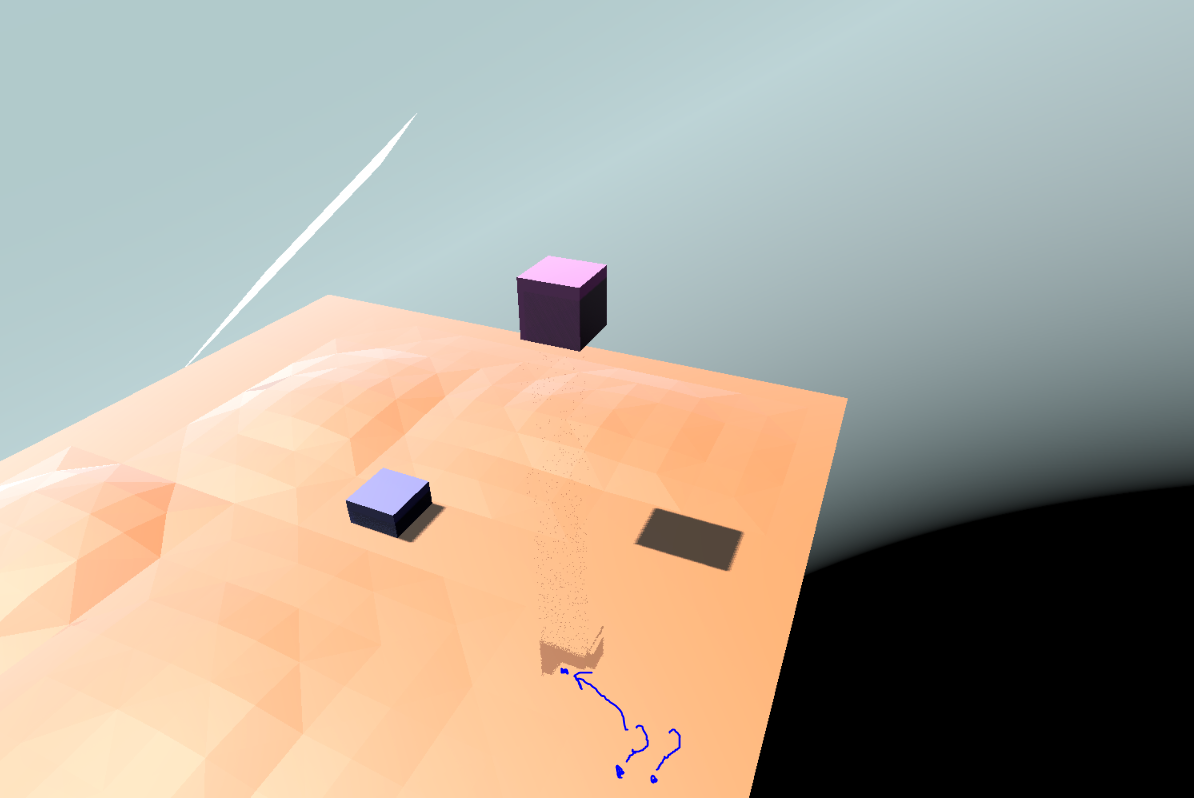
It would be very nice to step into the fragment shader of this post processing shader in your favourite debugger and see why the artifacts are showing up… But unfortunately, there aren’t any vulkan shader debugging tools available quite yet.
An ideal solution, would be to have the ability to select a pixel, and debug the fragment shader that calculated its color.
I really wanted to figure out exactly what was going on in the GPU, so I implemented this solution to do what I just described.
Firstly, I found a cool library called VML written by Valentin Galea that would allow for the user to nicely copy paste GLSL code into C++ and have it compile. However, it was not intended for GPU behavior emulation, but as a replacement for the whole pipeline (for example, to run on mobile and debug it easily, have the C++-GLSL code directly calculate the fragment colors instead of having the GPU do it). Nevertheless, it still provided a very solid base for what I was going to do.
Functionality that I had to add to VML to make this thing work
VML provides the code for allowing syntax like this:
vec4 foo = vec4(1.0, 2.0, 3.0, 4.0);
vec3 bar = foo.zzz;
to be compiled in C++.
It also provided all the math functions / utilities (matrix multiplication, sin, cos, smoothstep, etc…).
However, one thing that I needed to add was sampling from textures and (because I am in Vulkan), push constants.
To put it simply, during the setup of the program, the user sets the texture inputs of the frame to be captured (basically the texture inputs of the post processing stage).
Once the frame is captured, the inputs and the output are blitted into linearly tiled images (so that the CPU can sample from it).
Then, the user clicks on a pixel (and with some viewport and scissor calculations), the pixel coordinates are then stored somewhere.
Once those are returned, and the pixel coordinate is calculated, we have to setup the uniforms for the C++-GLSL shader.
The code for this looks a little like this:
Including the GLSL code
namespace glsl
{
    gpu_t *g_dbg_gpu_ptr;

// =============== INCLUDE GLSL CODE HERE =================
#include "shaders/pfx_ssr_c.hpp"
// ===============
}
The funcion to call the code
// dbg_pfx_frame_capture_t contains the sampler data (the blitted linear images, etc...)
vector4_t
invoke_glsl_code(dbg_pfx_frame_capture_t *capture, const vector2_t &uvs, camera_t *camera, gpu_t *gpu)
{
    glsl::g_dbg_gpu_ptr = gpu;

    // Set the push constants
    glsl::pk_t pk;
    pk.foo = bar;
    ...
    PUSH_CONSTANT(light_info_pk, pk);

    // Set the uniforms (in this case, there is only availability for setting sampler2Ds)
    sampler2d_ptr_t gfinal = sampler2d_ptr_t{&capture->samplers[0]};
    SET_UNIFORM(g_final, gfinal);
    sampler2d_ptr_t gposition = sampler2d_ptr_t{&capture->samplers[1]};
    SET_UNIFORM(g_position, gposition);
    ...

    // Set the VS_DATA (in the shader), the shaders vertex data is sent like this:
    // layout(location) in VS_DATA {...} fs_in;
    glsl::vs_data_t vs_data = {};
    vs_data.uvs.x = uvs.x;
    vs_data.uvs.y = uvs.y;
    ...
    SET_VS_DATA(fs_in, vs_data);

    // Start the memory maps
    capture->prepare_memory_maps(gpu);
    {
        // If in debug mode of course
        __debugbreak();
        glsl::main();
    }
    capture->end_memory_maps(gpu);

    vector4_t final_color = vector4_t(glsl::final_color.x, glsl::final_color.y, glsl::final_color.z, 1.0f);
    return(final_color);
}
The reason that the types glsl::vs_data_t and glsl::pk_t exist is because in the fragment shader, as said in the comments, the fragment’s in data is defined like this : layout(location = 0) in VS_DATA {...} fs_in;, and as for the push constant: layout(push_constant) uniform Push_K {...} pk_name;. This means that, before I include the GLSL code, I can just
#define VS_DATA struct vs_data_t
#define Push_K struct pk_t
Also, to be able to cleanly do SET_UNIFORM(sampler_name, cpu_sampler_pointer), I just do this:
#define PUSH_CONSTANT(name, push_k_data) glsl::##name = push_k_data
#define SET_UNIFORM(name, uni) glsl::##name = uni
#define SET_VS_DATA(name, data) glsl::##name = data
The Result
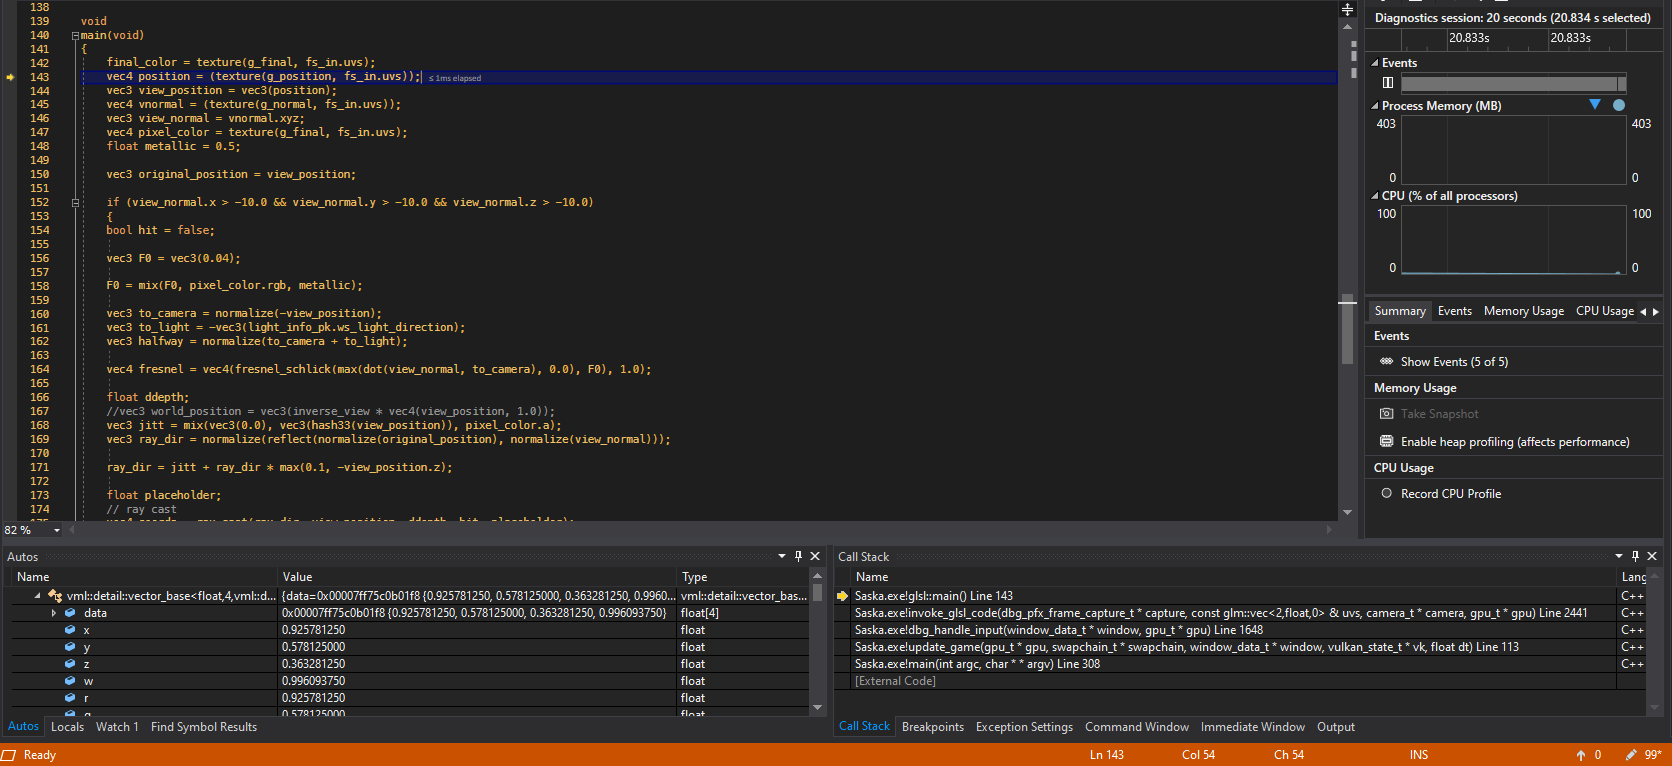
Now, with all this in mind, we can step through the vulkan shaders code in the debugger!
In my project, the way I start a frame capture is through my console (which will be another article), however, if you decide to use this for yourself, you can do it any way you like (key binding, or whatever…) :
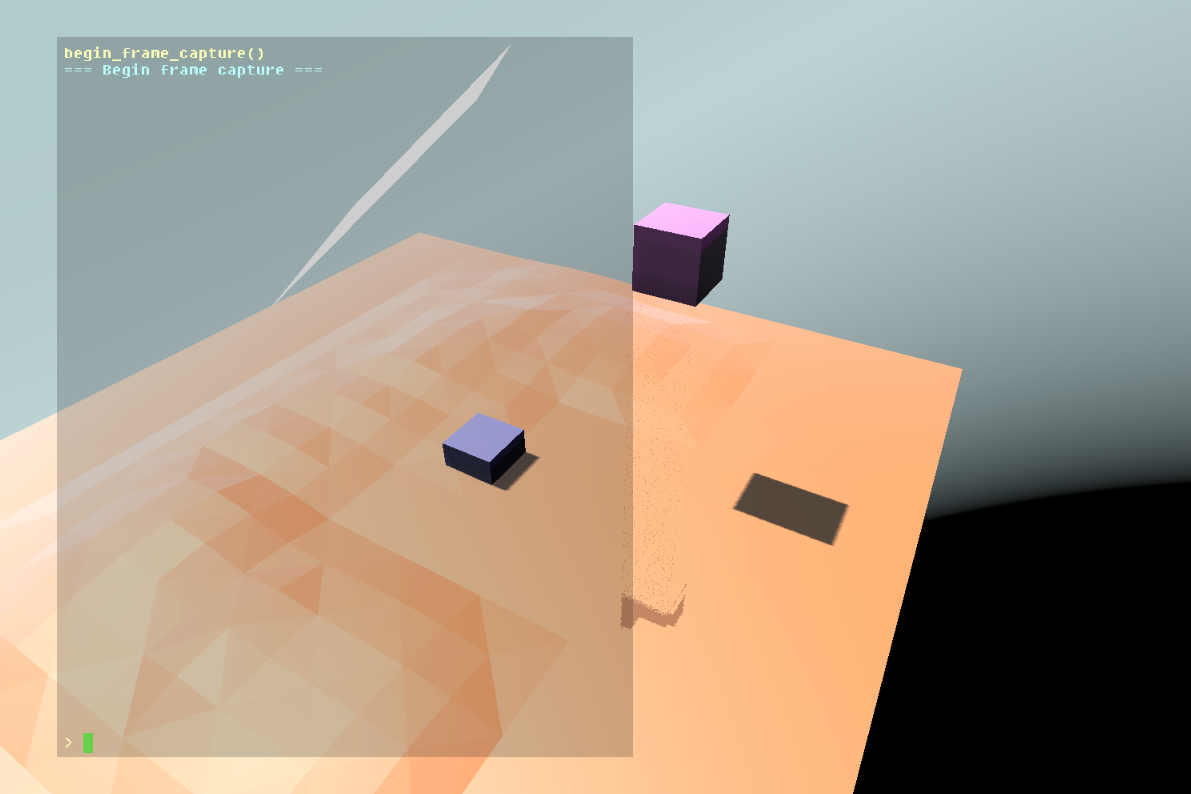
Then I click on the pixel I would like to debug and, voila:
If you wish to read the code, I currently just threw it all in one file, with all my other “graphics”-related code, so it will be hard to find in that file. I will make sure to isolate it, make it more portable and in some easy to use library so that others can use it with the least possible effort. For now though, here is the code at the end of the file - line 2331.